
CipherTrade — Crypto Market Dashboard
Live market data that stays easy to read
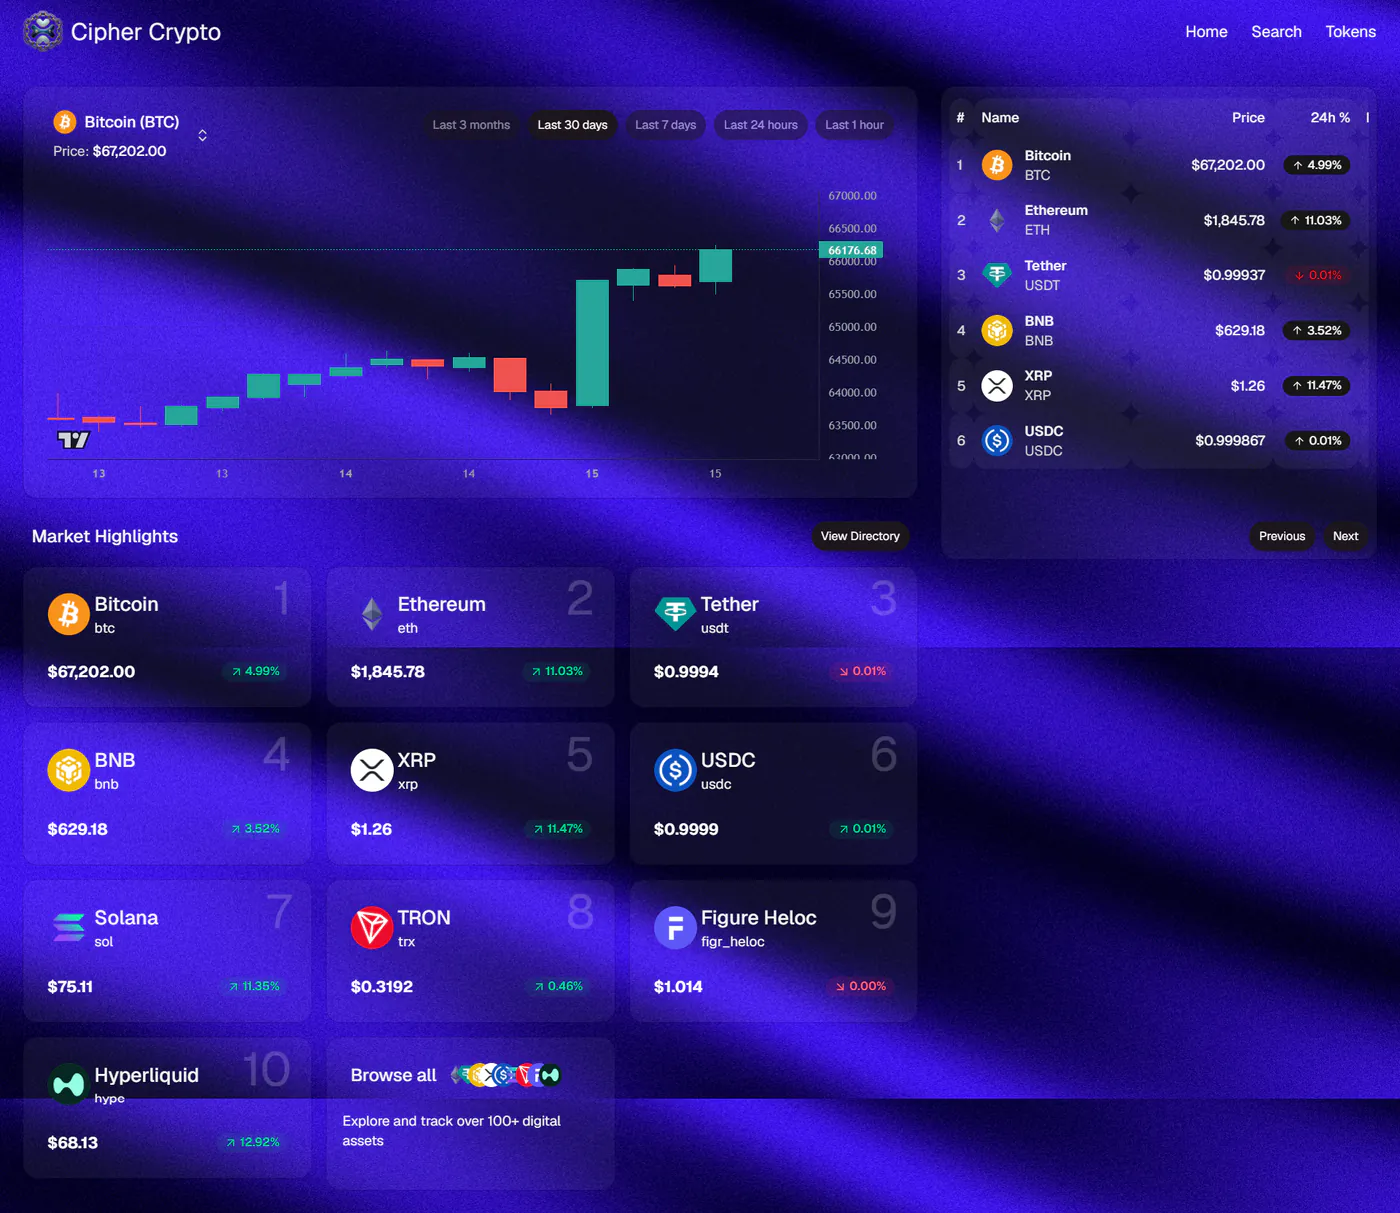
CipherTrade is a crypto market dashboard: live prices, trending coins, a page for every coin and charts you can actually explore. Crypto data changes constantly and there is a lot of it. The job was to show all of it quickly without the page turning into a wall of numbers.
- Type
- Crypto market dashboard
- Role
- Front-end development & UI
- Core stack
- Next.js 16 · React 19 · TypeScript · Tailwind CSS v4
- Focus
- Live data, charts, data tables
The problem
A market dashboard has two kinds of visitor. One wants a quick look: what is Bitcoin doing, what is moving today. The other wants to dig in: compare coins, sort by change, study a chart over three months. A page built only for the first feels thin, and a page built only for the second is overwhelming.
The data also comes from an outside API, so every page has to deal with loading, errors and prices that change while you are looking at them.
What I built
A Next.js 16 App Router app in React 19 and TypeScript, styled with Tailwind CSS v4 and shadcn/ui components on top of Radix UI, with live market data from the CoinGecko API. It is deployed on Vercel, with ESLint and Prettier (including the Tailwind plugin) keeping the code consistent.
Home dashboard: a candlestick chart for the selected coin with time ranges from the last hour to the last three months, a top-coins table beside it, and market highlight cards for the top ten.
Coin search: find any coin by name or symbol and jump straight to its page.
Coin detail pages: one page per coin with its price, 24-hour change and an interactive chart.
Tokens page: a full directory of 100+ assets in a sortable table built with TanStack Table, with drag-and-drop columns powered by dnd-kit.
Two chart libraries: TradingView Lightweight Charts for candlesticks and Recharts for interactive area charts.
Polished UI details: Lucide icons, Sonner toasts, Vaul drawers, a light and dark theme with next-themes, and a 3D animated background built with Three.js and React Three Fiber.
The technical decisions, and why
Two chart libraries, each used for what it does best
Candlesticks are a trading chart: many data points, zooming and a price scale that has to feel right. TradingView Lightweight Charts is built for exactly that. Area charts on the coin pages are simpler and need to match the rest of the React UI, which is where Recharts fits. Using one library for both would have meant a worse candlestick chart or a heavier, harder-to-style area chart.
Up and down shown with more than colour
Every price change is shown in green or red, but also with an up or down arrow. Around one in twelve men has some form of colour blindness, and red versus green is the most common pair to confuse. The arrow means the table and the cards still make sense for them, and on a dark background at a small size.
A real data table instead of a styled list
The tokens page uses TanStack Table, so sorting, pagination and column control come from a tested library rather than hand-written code. dnd-kit adds drag-and-drop on top, so users can put the columns they care about first. Both are headless, so the table still looks like the rest of the dashboard.
Checking API data before it reaches the UI
Data from an outside API can change shape or come back incomplete. Responses are checked with Zod, so a missing or unexpected field is caught in one place instead of showing up as “NaN” or a crashed component somewhere on the page.
A 3D background that stays in the background
The animated Three.js background gives the dashboard its look, but the data is the point of the page. The scene sits behind semi-transparent panels, so the charts and prices stay readable on top of it and the motion never competes with the numbers.
Where it landed
The dashboard works for both kinds of visitor: the home page gives a quick read of the market in seconds, and the coin pages and tokens table give plenty of room to dig deeper.
The main lesson is that a data-heavy app is mostly about choosing the right tool for each job. The right chart library, a proper table library and a validation layer did more for the final result than any amount of custom code would have.