
Holdytic — Prediction Market Explorer
Reading the odds without placing a bet
Holdytic shows what prediction markets currently think will happen, from elections and wars to interest rates and football. It reads live data from Polymarket, keeps it fresh without a reload, and adds one thing the markets do not show: a measured answer to how often those odds turned out to be right.
- Type
- Live data web app
- Role
- Front-end and API integration
- Core stack
- Next.js 16 · React 19 · TypeScript · Tailwind CSS v4
- Focus
- Live data, clear charts, honest numbers
The problem
Polymarket has thousands of open markets, and its own site is built for trading. Someone who only wants to know what the market thinks, how much money is behind it and how the odds have moved has to dig past order forms and account prompts to find it.
The data comes from three separate public APIs that mix strings and numbers, leave fields out and sometimes fail. The site had to stay readable when that happens, and it had to stay current without hammering the upstream service.
What I built
A Next.js 16 App Router site in TypeScript, styled with Tailwind CSS v4, with GSAP for entrance animations. It needs no API keys and is deployed on Vercel.
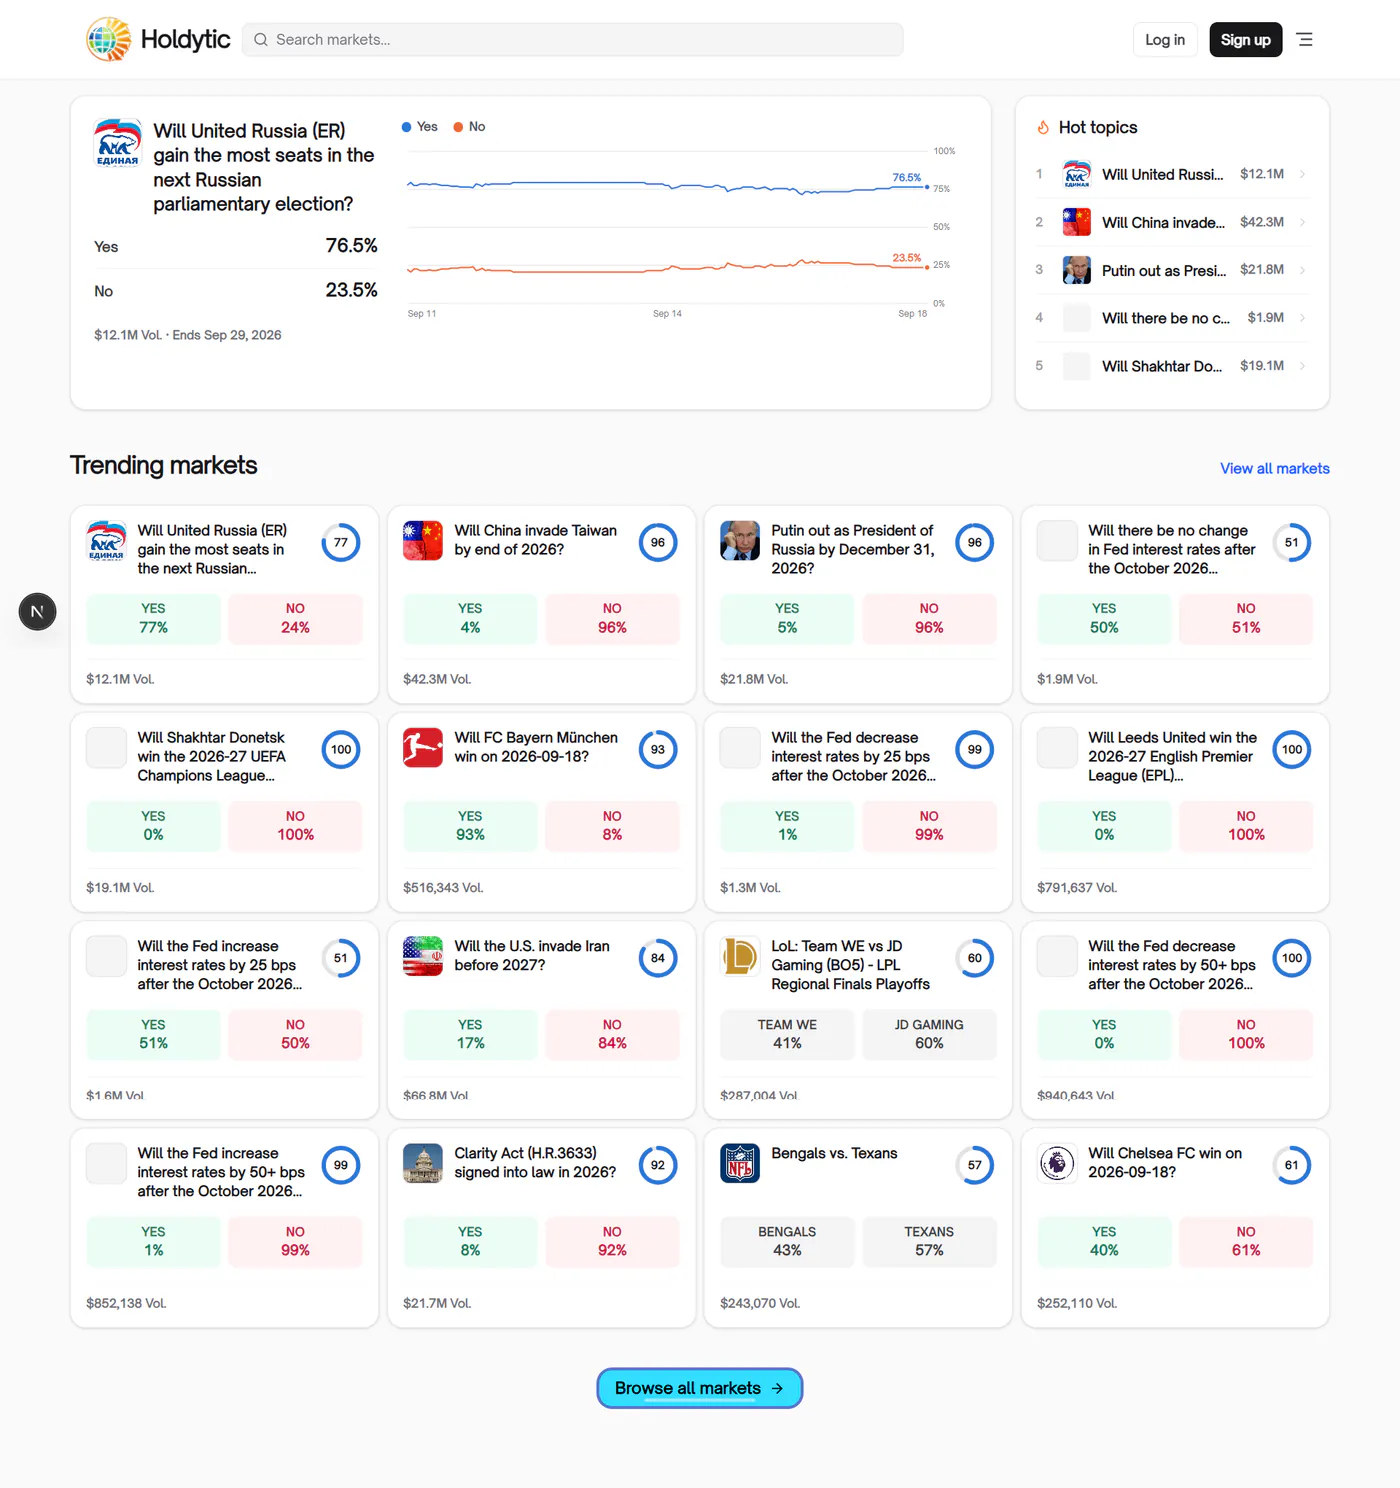
Home page: a featured market with a Yes/No price chart, a hot-topics list ranked by volume, and a grid of 16 trending markets.
All markets: category tabs for politics, sports, crypto and more, search, and a load-more button, all driven by the URL.
Market detail: a price chart with ranges from one hour to all time, the order book with depth bars, top holders, recent trades, comments and related markets.
Accuracy page: Brier scores, a calibration chart and accuracy by trading volume, worked out from about 140 resolved markets.
Secondary pages: about, contact, terms and privacy pages that share one layout for their text.
The technical decisions, and why
One folder talks to Polymarket
Every upstream call goes through lib/polymarket/. One client file owns the base URLs, the 30-second cache and what happens on failure, and the other modules are split by job: markets, prices, activity and accuracy. A failed request returns an empty result, so a page shows an empty state instead of crashing. A separate format module turns the mixed fields into display values, so a missing number shows as a dash rather than $undefined.
Lists get a small version of each market
The full market object is large. Every list uses a trimmed version with just the id, question, image, two outcomes, volume and end date, and the full object is only loaded on the detail page. Doing that trim on the server cuts the data sent to the browser to about a quarter of its raw size.
Server first, then polling
Each page loads its data on the server, so the first paint already has real numbers. A useMarkets hook then polls an internal API route every 30 seconds with the current search and category. Polling stops while the tab is hidden, and an older request is cancelled when a newer one starts, so a slow reply can never overwrite fresh data.
Charts in plain SVG, with colour-blind-safe colours
The price charts are drawn with inline SVG instead of a charting library. The obvious green and red for Yes and No was rejected because many colour-blind readers cannot tell them apart, so the two lines use a blue and orange pair that was checked for separation against the white background.
Accuracy is measured, not claimed
The accuracy page does not state a number someone wrote down. It samples resolved markets across the volume range, reads each price at six points before the market closed, and scores it against what really happened. The result is cached for six hours, streams in behind a loading state, and the page lists its own sample size, filters and limits.
Where it landed
The finished site lets someone scan the busiest markets, follow the odds as they move and open any market for the full picture, all without an account or a trading form. Anything that needs a funded Polymarket account links out instead of being copied.
The main lesson is to keep outside data behind one small layer. Because every call, cache rule and failure case lives in one folder, the pages stay simple, and a change in the upstream API is a change in one place.
Built with
Related work
CipherTrade — Crypto Market Dashboard
A dark-themed crypto dashboard in Next.js 16 and React 19 with live CoinGecko prices, TradingView candlestick charts, Recharts area charts and sortable drag-and-drop tables.
Fern — Administrative Dashboard
Building a Next.js + TypeScript admin dashboard: revenue analytics, order tracking and inventory, and the server/client rendering decisions behind it.