
Dashboards & Data-Heavy Interfaces
Dense screens that stay readable as panels are added
Dashboards fail in a predictable way. Someone asks for one more metric, each request is reasonable on its own, and six months later everything on screen has equal weight and nobody can find the number they came for. Ranking the panels is the design work; keeping the render cost flat is the engineering work.
- Framework
- Next.js, React 19, TypeScript
- Tables & charts
- TanStack Table, Recharts, TradingView, inline SVG
- Data
- CoinGecko, Polymarket and internal APIs
- Styling
- Tailwind CSS v4
What the build includes
An information hierarchy where type scale, colour and position encode urgency, so the exception is what breaks the grid
Live data with polling that pauses on a hidden tab and cancels a stale request before it can overwrite fresh numbers
Charts chosen for the question being asked — time series, candlesticks or plain SVG — with colour pairs checked for colour-blind separation
Sortable, filterable, reorderable tables that keep their state where the visitor expects it
Empty, loading and failure states on every panel, because a dashboard with a blank square is a support ticket
Work that shows it
Each of these is a full case study — the problem, what I built, and the technical decisions behind it.
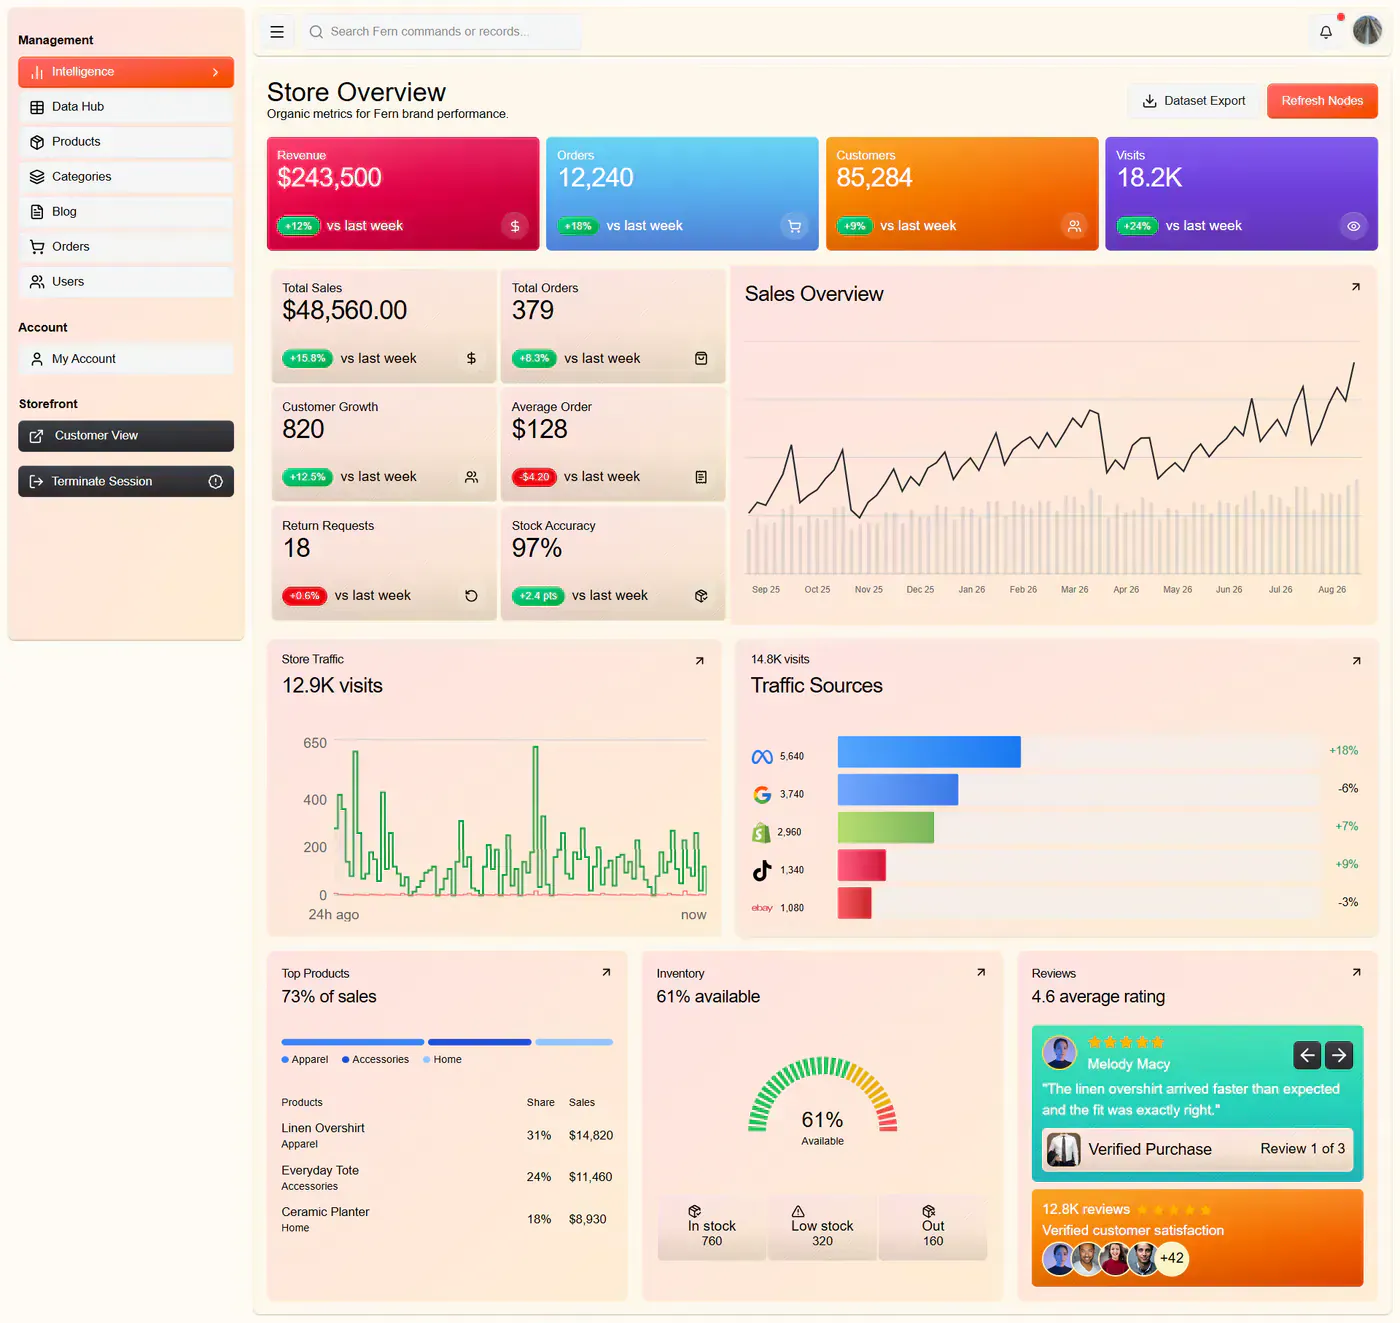
Fern — Administrative Dashboard
Building a Next.js + TypeScript admin dashboard: revenue analytics, order tracking and inventory, and the server/client rendering decisions behind it.
Next.jsTypeScriptTailwind CSSAnalytics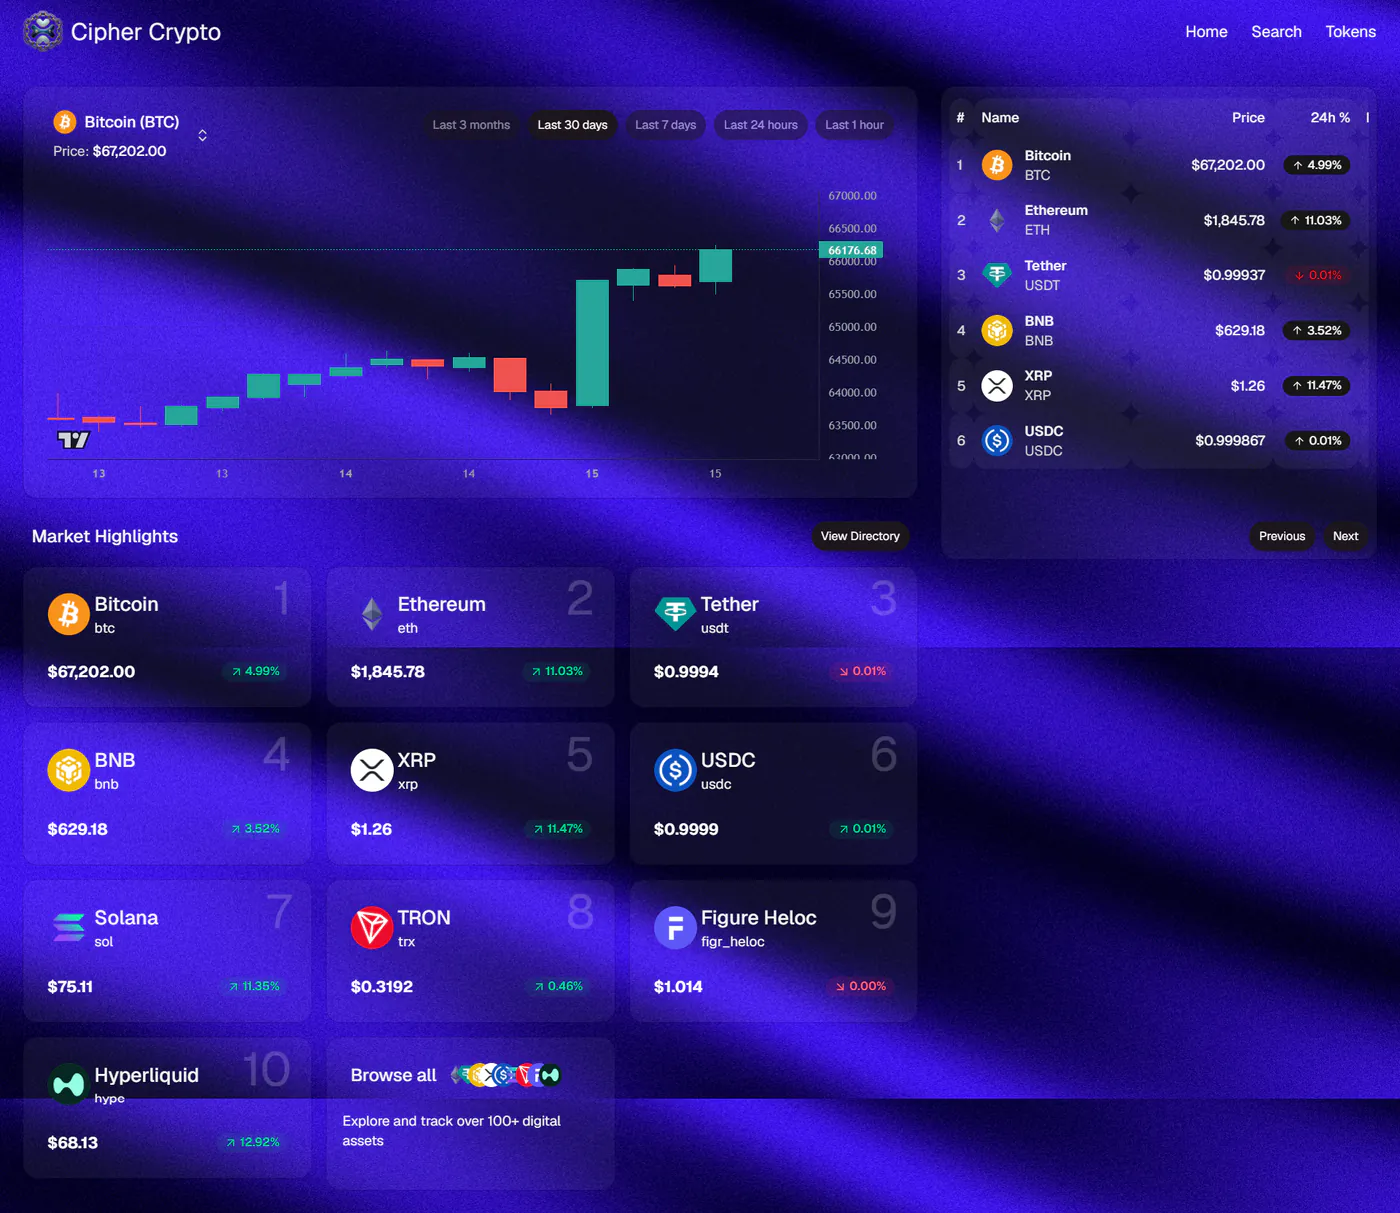
CipherTrade — Crypto Market Dashboard
A dark crypto dashboard in Next.js 16 and React 19 — live CoinGecko prices, TradingView candlesticks, Recharts areas and sortable drag-and-drop tables.
Next.js 16React 19TypeScriptTailwind CSS v4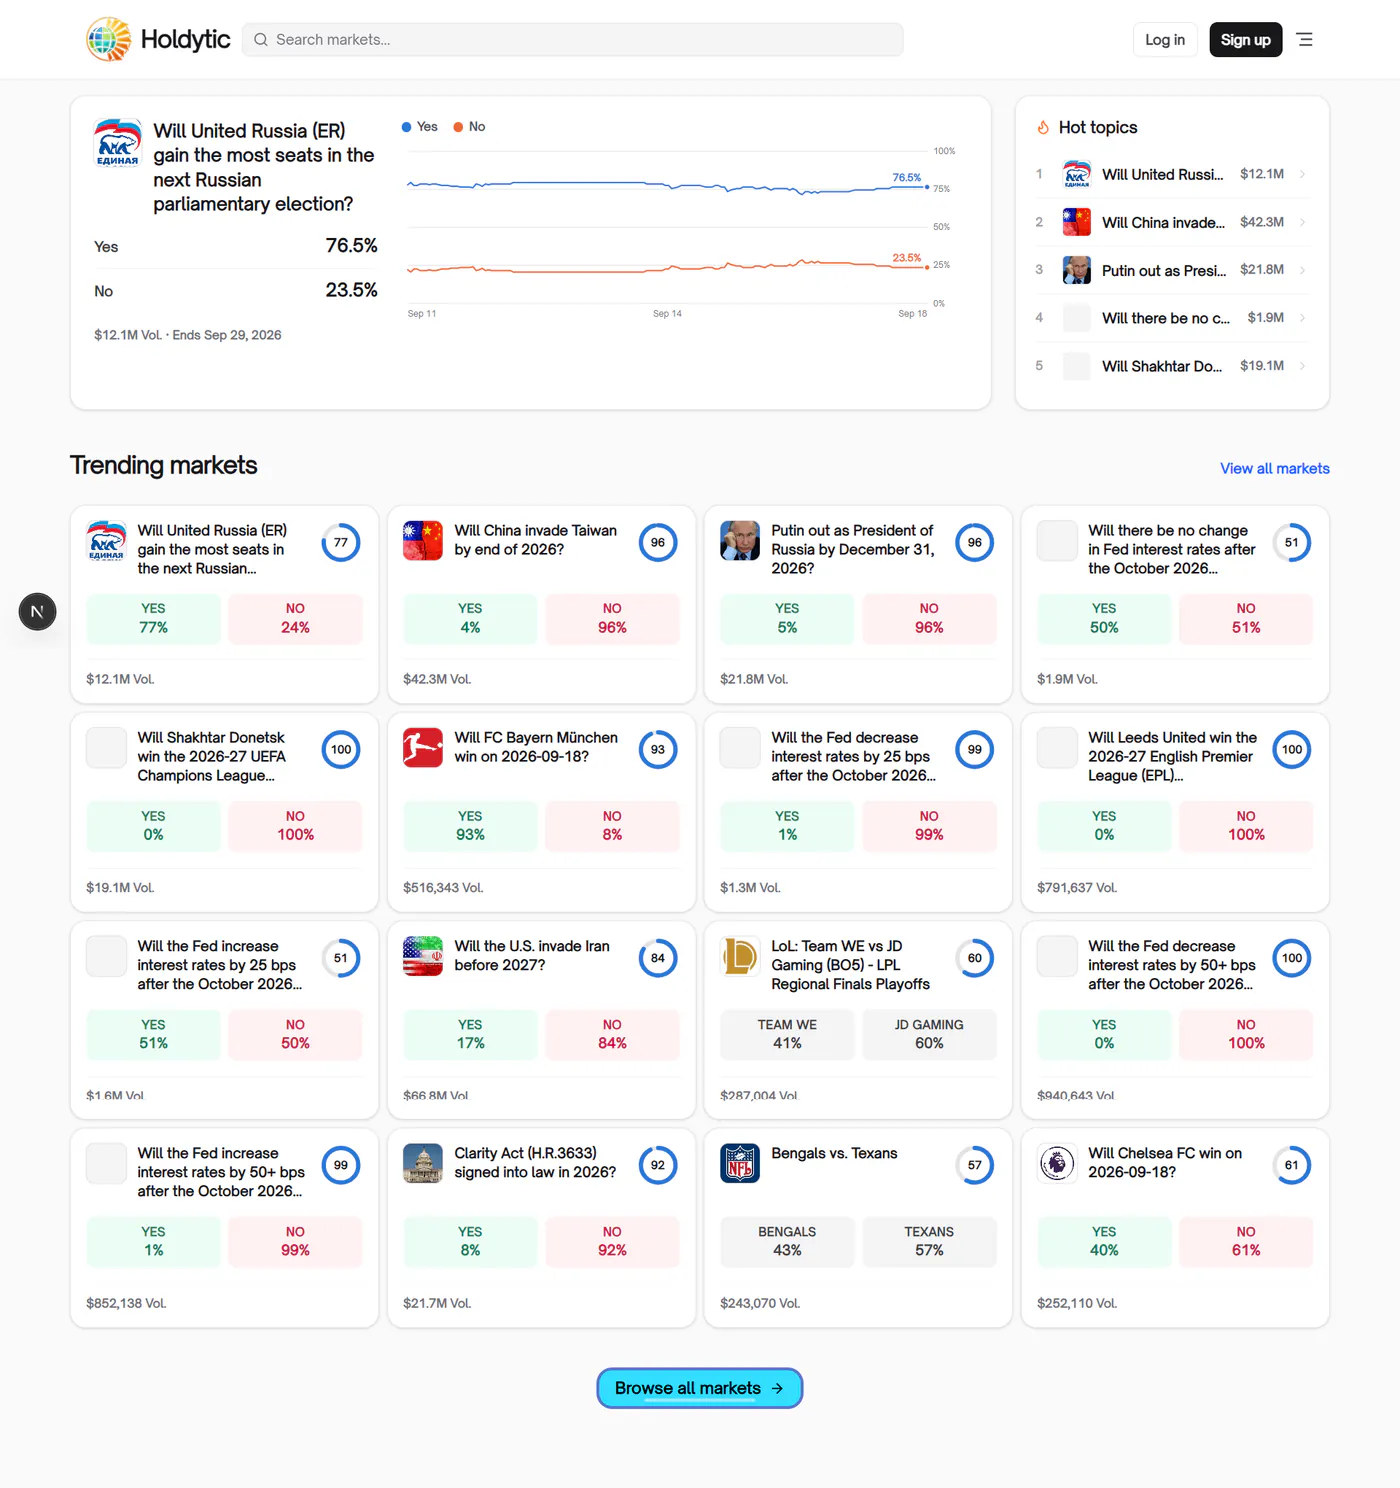
Holdytic — Prediction Market Explorer
A Next.js 16 explorer for Polymarket data: live odds and volume, price charts in plain SVG, order books, and an accuracy page that scores past market prices.
Next.js 16React 19TypeScriptTailwind CSS v4
Often part of the same project
Next.js & React Web App Development
Production Next.js and React builds in TypeScript — App Router, server components, typed data boundaries, and a bundle that scales with how much of the page is interactive.
Full-Stack SaaS & E-Commerce Development
End-to-end product builds — authentication and role-based access, payments confirmed by webhook, database schemas, file storage, and the dashboards on top of them.